Each week, we are tracking a snapshot of year-over-year distributor revenue with our Pandemic Revenue Index (PRI). Here’s the latest graph:
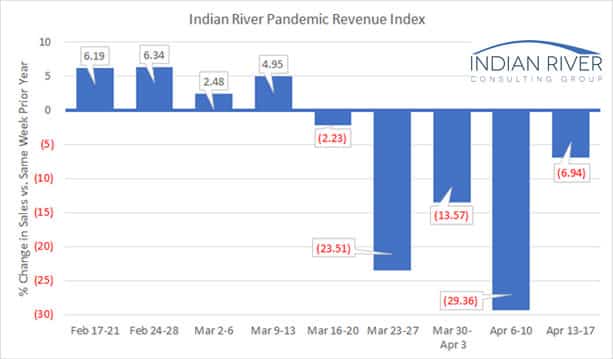
This week’s index shows a sales decline over the same week in 2019 of 6.9%. Although the sales decline is much lower than previous weeks it is likely that this is not a reflection of significantly improving business conditions. One of the firms in the sample shipped a very large project that had a large impact on the overall index. When this firm is excluded, the remaining firms showed an average decline of 18.9%.
The sample size for the week of April 13-17 data is nine firms, same as last week. We expect that the sample size will continue to increase weekly. We would like to increase the sample size and are asking you to consider helping the industry through these uncertain and unprecedented times. If you are interested, reach out to Mike Emerson, IRCG Partner, at memerson@ircg.com.
As the governors of some states have indicated that they will begin easing stay-at-home restrictions and allowing additional businesses to reopen it will be interesting to see if the index trends upwards. Unfortunately, the majority of the distributors in our sample are large regional companies, so it would be difficult to pinpoint influences from individual states.
Thanks for following along with us as we analyze the impact of this pandemic. As we collect more experiences, we will continue to share patterns as they emerge.