Each week, we’ll be tracking a snapshot of year-over-year distributor revenue with our Pandemic Revenue Index (PRI). We would like to increase the sample size and are asking you to consider helping the industry through these uncertain and unprecedented times. If you are interested, reach out to Mike Emerson, at memerson@ircg.com. The sample size for the week of August 24-28 is 12 firms, which is the same as last week.
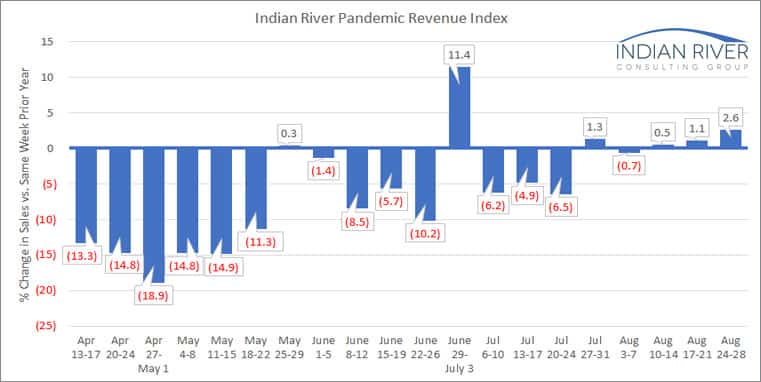
This week’s index shows a sales increase of 2.6% over the same week in 2019. This is the third straight week that the index has posted a gain. Over the last few months, a pattern has emerged that the week containing the last business day of the month shows an uptick, but the week preceding it is usually pretty weak. Hopefully, with the last day of the month coming next week, the growth trend strengthens.
Five of the index participants saw a sales gain vs the same week in 2019. The sales gains ranged from 3.2% to 38% with the decreases ranging from 1% to 30%. Let this wide variation be a reminder that although the index is trending positive, there is a lot of volatility within it.
Thanks for following along with us as we analyze the impact of this pandemic. As we collect more experiences, we will continue to share patterns as they emerge.