Each week, we are tracking a snapshot of year-over-year distributor revenue with our Pandemic Revenue Index (PRI). Here’s the latest graph: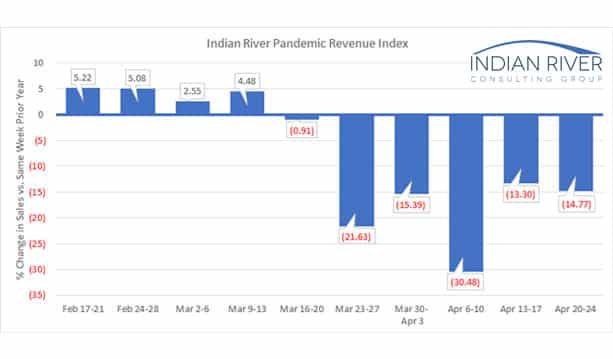 This week’s index shows a sales decline over the same week in 2019 of 14.8%. The sample size for the week of April 20-24 is 10 firms, which is an increase of one over last week. Incorporating the new participant’s historical data into the index caused some minor changes to previous weeks’ values.
We expect that the sample size will continue to increase weekly. We would like to increase the sample size and are asking you to consider helping the industry through these uncertain and unprecedented times. If you are interested, reach out to Mike Emerson, at memerson@ircg.com.
Of the 10 firms participating in the survey, seven saw declines in sales compared with the same week last year with 52.4% being the largest decline. Two companies saw increases and one was basically flat. So far, all but one participant has realized an aggregate sales decline over the past five weeks with an average decline of 22.4%. A big project order that shipped last week is responsible for the sales growth of the one company not showing an overall decline.
Thanks for following along with us as we analyze the impact of this pandemic. As we collect more experiences, we will continue to share patterns as they emerge. The next few weeks should be interesting as states begin to restart their economies. Stay tuned.