Each week, we’ll be tracking a snapshot of year-over-year distributor revenue with our Pandemic Revenue Index (PRI). Here’s the latest graph:
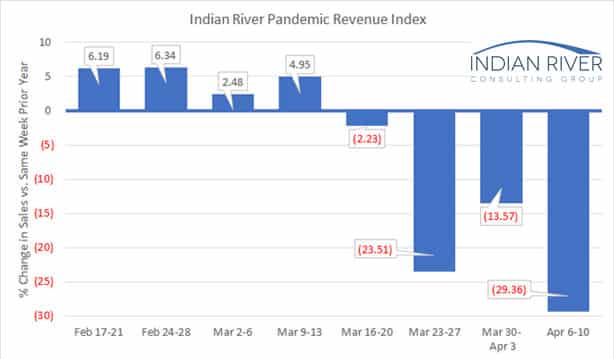
This week’s index shows a sales decline over the same week in 2019 of 29.4%, which confirms that the improvement in the prior week was an anomaly as we expected.
The sample size for the week of April 6-10 data is nine firms, up one from last week. We expect that the sample size will continue to increase weekly. To help us increase the sample size, we are asking you to consider helping the industry through these uncertain and unprecedented times. If you are interested in participating, reach out to Mike Emerson, IRCG Partner, at memerson@ircg.com.
There is a fair amount of confusion right now. We’re all hearing that the “opening up of the economy” is around the corner at the end of April from some – and end of summer from others. Things might become clearer in the next few weeks as to whether “we’ve reached the apex,” which most agree is a prerequisite for easing the stay-at-home orders.
Thanks for following along with us as we analyze the impact of this pandemic. As we collect more experiences, we will continue to share patterns as they emerge.