Each week, we’ll be tracking a snapshot of year-over-year distributor revenue with our Pandemic Revenue Index (PRI). We would like to increase the sample size and are asking you to consider helping the industry through these uncertain and unprecedented times. If you are interested, reach out to Mike Emerson, at memerson@ircg.com. The sample size for the week of August 31-September 4 is 12 firms, which is the same as last week.
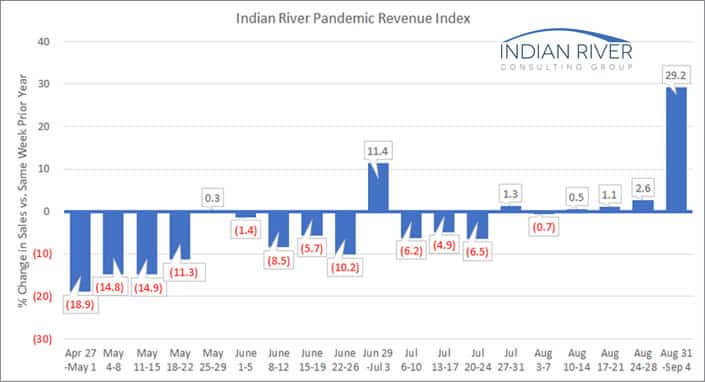
This week’s index shows a sales increase of 29.2% over the same week a year ago, which is driven by Labor Day falling during this same week in 2019. Thus, resulting in a five-day week in 2020 vs a four-day week in 2019. Considering there were 25% more selling days in 2020, a normalized increase would be 3.4%. We’ll see to what degree the trend occurs in reverse next week.
Even with the five days vs four comparison, one participant saw a sales decrease. The increases ranged from 5% to 70%, which adjusted for the additional selling day would equate to negative 16% and positive 36%.
Thanks for following along with us as we analyze the impact of this pandemic. As we collect more experiences, we will continue to share patterns as they emerge.