Each week, we’ll be tracking a snapshot of year-over-year distributor revenue with our Pandemic Revenue Index (PRI). We would like to increase the sample size and are asking you to consider helping the industry through these uncertain and unprecedented times. If you are interested, reach out to Mike Emerson, at memerson@ircg.com. The sample size for the week of August 9-14 is twelve firms, which is the same as last week.
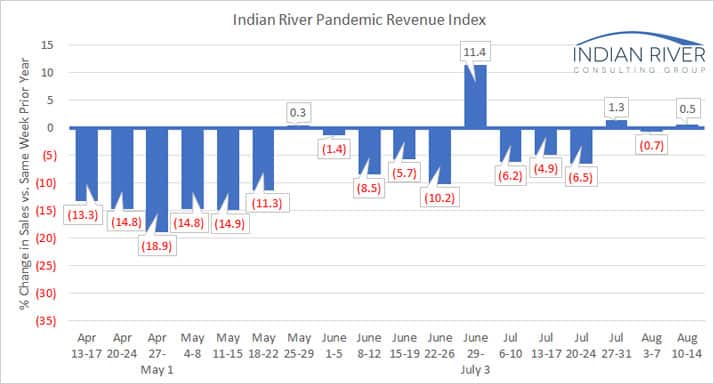
This week’s index shows an increase in sales of 0.5% compared to the same week in 2019. This represents sales growth in two of the last three weeks and the first mid-month sales increase since March (previous sales increases all corresponded with the last week of a month).
As was the case last week, half of the index participants saw a sales gain vs. the same week in 2019. The sales declines ranged from 9.8% to 20% while the increases ranged from 2% to 39.7%. Over the last four weeks, only two companies have seen increases each week vs. last year and the same number have seen four consecutive weeks of declines. Size, geography or industry do not appear to have an effect on the reported sales performance.
Looking Back Over 26 Weeks
Twenty-two weeks ago, Indian River Consulting Group (IRCG) first published the PRI when six distribution companies provided us their sales for the previous week vs. those from the prior year. The number of companies now participating is up to twelve and they span many different industry verticals both durable and non-durable.
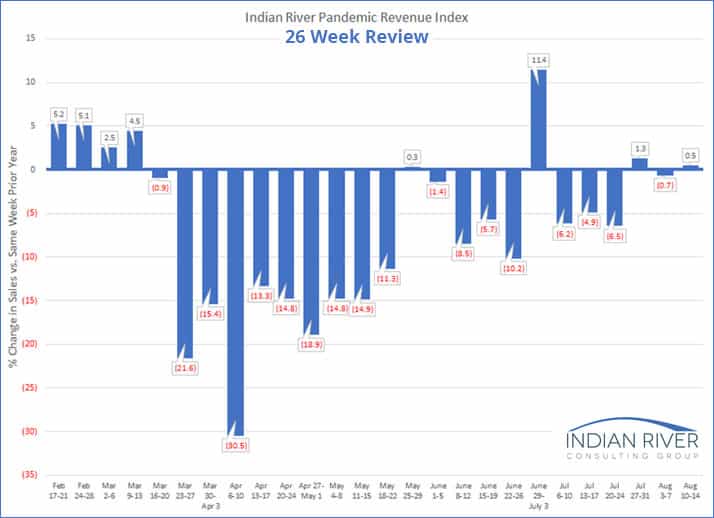
Upon the occasion of having 26 weeks of data, we thought it would be helpful to look back over the half year of data we’ve collected. As the chart indicates, the first publication of the Index corresponds with the first pandemic related sales decline. Now, 26 weeks later, we’ve seen sales growth in two of the last three weeks. It sure would be great if the steep climb we’ve made over the last six months to get out of that spring hole is behind us.
Thanks for following along with us as we analyze the impact of this pandemic. As we collect more experiences, we will continue to share patterns as they emerge.
* The spike during the week of June 29 to July 3 likely reflects the timing of the July 4th holiday falling on Saturday compared with Thursday in 2019 resulting in an extra selling day.