Each week, we’ll be tracking a snapshot of year-over-year distributor revenue with our Pandemic Revenue Index (PRI). We would like to increase the sample size and are asking you to consider helping the industry through these uncertain and unprecedented times. If you are interested, reach out to Mike Emerson, at memerson@ircg.com. The sample size for the week of August 3-7 is twelve firms, which is an increase of two over last week. Several weeks of history from the new participants has been folded into the index so you’ll find slight changes to previously reported percentages.
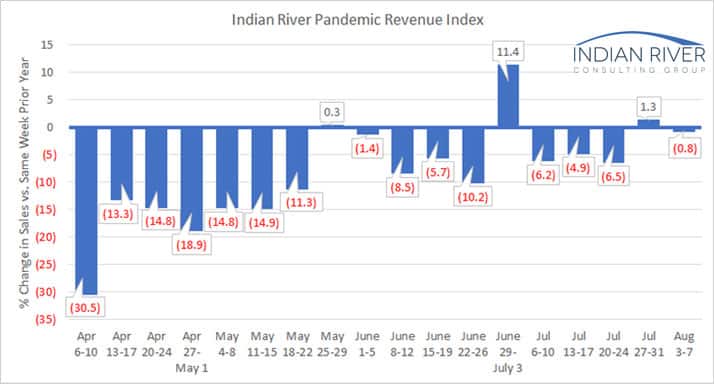
This week’s index shows a decrease in sales of 0.8% compared to the same week in 2019. It’s interesting that the last two weeks very closely mirror what we saw at the end of May and beginning of June. The last week of the month showed very rare instances of growth with the following week showing a small decline. If the pattern holds, the next few weeks will show greater declines.
As was the case last week, half of the index participants saw a sales gain vs the same week in 2019. However, there was a much larger variance within the cohort with the best result being 38% growth and the worst performing at an offsetting 38% sales decline.
Thanks for following along with us as we analyze the impact of this pandemic. As we collect more experiences, we will continue to share patterns as they emerge. Next week we will have collected 26 weeks worth of data so we’ll be able to look at half year trends.