Each week, we’ll be tracking a snapshot of year-over-year distributor revenue with our Pandemic Revenue Index (PRI). We would like to increase the sample size and are asking you to consider helping the industry through these uncertain and unprecedented times. If you are interested, reach out to Mike Emerson, at memerson@ircg.com. The sample size for the week of July 27-31 is ten firms, which is the same as last week.
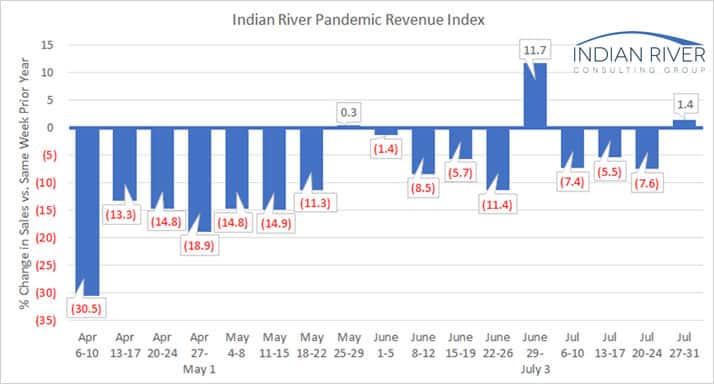
The month of July closes with a sales increase as this week’s index shows sales up 1.4% compared to the same week in 2019. If the week that includes July 4 is excluded because it includes an extra business day, this is the largest increase the index has shown since the week of March 9, which is the week immediately preceding the pandemic-induced downturn. It would also be the second increase.
Half of the index participants saw a sales gain last week topping out at 17% with the largest decrease reported at 12%. You’ve got to go all the way back to the week of March 2 to find a week where the index did not have a participant with a decline greater than 12%.
As much as last week was a sight for sore eyes, it’s going to take a series of weeks before we can start to draw any conclusions considering all the conflicting data we are seeing elsewhere.
Thanks for following along with us as we analyze the impact of this pandemic. As we collect more experiences, we will continue to share patterns as they emerge.