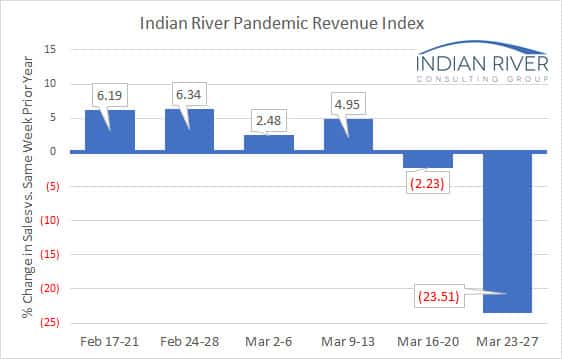
Each week, we’ll be tracking a snapshot of year-over-year distributor revenue with our Pandemic Revenue Index (PRI). Here’s the latest graph:
Unfortunately, the industry continues to reflect a state of decline. The distributor revenue decline this past week was 23.51% compared to the same week in 2019.
With the spike in unemployment claims, there should be no surprise with this decline. The safe bet is that the rate of decline will only increase in the short term, so stay tuned for updates next week.
You may notice that our value from the week of March 16-20 is now showing -2.23% instead of -5.56%. This is due to having increased participants in the sample and us having included their historical sales into our baseline.
The sample size for the week of March 23-27 data is eight firms. We expect that the sample size will continue to increase weekly. We would like to increase the sample size and are asking you to consider helping the industry through these uncertain and unprecedented times. If you are interested, reach out to Mike Emerson, IRCG Partner, at memerson@ircg.com.
All distributors reporting data for the PRI saw decreases in sales relative to last year. We have had discussions with distributors that have not seen any decline, but the jury’s out on whether it’s just a matter of time for them, too. Now is the time to have a plan if the trend continues.
Thanks for following along with us as we analyze the impact of this pandemic. As we collect more experiences, we will continue to share patterns as they emerge.


