Each week, we’ll be tracking a snapshot of year-over-year distributor revenue with our Pandemic Revenue Index (PRI). Here’s the latest graph:
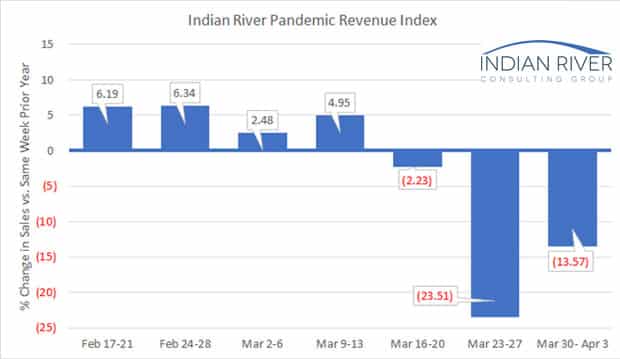
This week’s index shows a 13.6% sales decline over the same week in 2019, which is an improvement over the prior week’s index. However, there were some comments provided by respondents when they reported this week’s numbers, that the uplift in sales was due to large back-orders shipping, and not an indication that the situation is improving. When the exceptional sales mentioned by participants are excluded, the sales drop off would be very consistent to what we saw the prior week.
The sample size for the week of March 30-April 3, 2020, data is eight firms. We expect that the sample size will continue to increase weekly. We would like to increase the sample size and are asking you to consider helping the industry through these uncertain and unprecedented times. If you are interested, reach out to Mike Emerson, IRCG Partner, at memerson@ircg.com.
With the increase in “stay-at-home” orders and continued dramatic increases in unemployment, it will be very interesting to see what the next few weeks’ numbers look like.
Thanks for following along with us as we analyze the impact of this pandemic. As we collect more experiences, we will continue to share patterns as they emerge.