Each week, we’ll be tracking a snapshot of year-over-year distributor revenue with our Pandemic Revenue Index (PRI). We would like to increase the sample size and are asking you to consider helping the industry through these uncertain and unprecedented times. If you are interested, reach out to Mike Emerson, at memerson@ircg.com. The sample size for the week of August 17-21 is 12 firms, which is the same as last week.
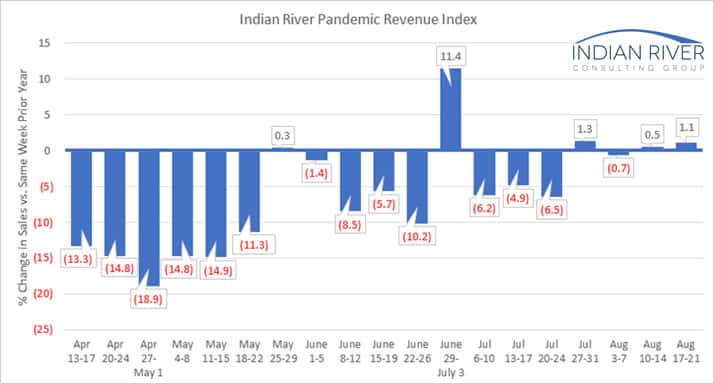
Sales have continued to display strength in August beyond the normal month-ending uptick we observed to close out July. This week’s index shows an increase in sales of 1.1% compared to the same week in 2019.
For the first time in five weeks, sales gains and losses were not evenly split among participants. Only five of the index participants saw a sales gain vs the same week in 2019. The sales gains ranged from 1.0% to 28.9% with the decreases ranging from 4.0% to 16.4%. The most significant decrease, coming in under 20%, has only occurred one other time in the last 23 weeks.
Thanks for following along with us as we analyze the impact of this pandemic. As we collect more experiences, we will continue to share patterns as they emerge.